Methods Used: Competitor Audit, Stakeholder Interview, Directed Storytelling, User Journey Mapping, Rapid Prototyping, Project Scoping, Stakeholder Walkthrough, Kano Analysis, High-Fidelity Wireframing
Tools Used: Zoom, Otter, Sketch, Sketchbook & Pen, Post-It Notes, Google Forms, Whiteboard, Keynote, Numbers
Key Themes: Accessibility, Diversity, Confidential Support, Building a Community
The whole team met with Radical PhD’s founder to learn about her organization’s goals and values
Gaining context
After scheduling our kickoff meeting, we completed a competitor audit to get a sense of what the PhD support space was like (I was responsible for three competitors). We found that Radical PhD had a distinctive focus on healing before productivity, and on serving the needs of marginalized and underrepresented groups in academia. I also found that coaches with substantial free resources available to students on their sites seemed to be more successful. This information helped frame the online stakeholder interview, which reinforced these findings and gave us valuable insights into what Radical PhD’s primary users are like.
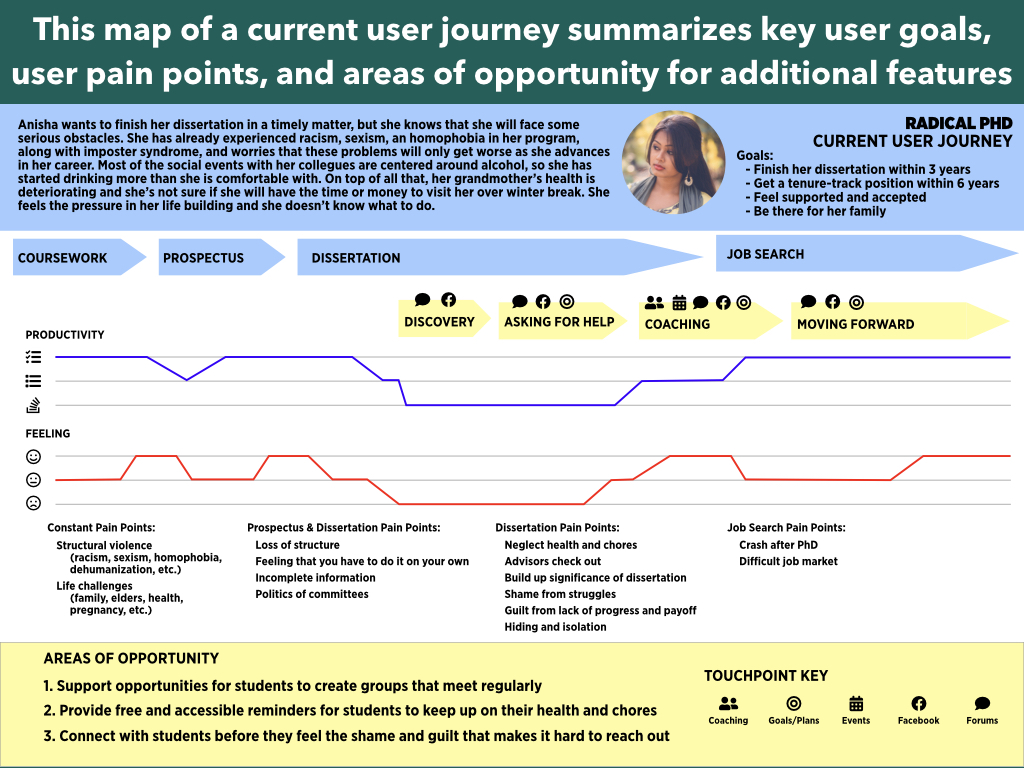
My user journey map introduces a persona and tracks her productivity and affective state as she encounters various pain points
Understanding the bigger picture
Doctoral students face a wide range of struggles at different points in their academic journey, so we wanted to get a better sense of when these pain points are most salient, and how they interact with Radical PhD’s existing touchpoints. So I made a current user journey map informed by the stakeholder interview and countless conversations with PhD students. This helped us identify areas of opportunity that guided the work to come.
One of my prototypes added a groups tab to an existing forum on Radical PhD to help students connect. The left sketch was from my ideation phase; the middle sketch communicated to a teammate how the feature would fit into the existing site; the right sketch was a team effort in preparation for the Kano analysis survey
Rapid prototyping
We spent two hours coming up with features and sketching them in just enough detail that a sentence or two paired with the sketch would effectively communicate the idea. Most of these ideas were inspired by our initial research and the areas of opportunity highlighted in the user journey map, but since the goal was maximal ideation, there were no constraints at this point.
Stakeholders looking at some of our prototypes
Scoping and feedback
We brought stakeholders in to evaluate the direction of the prototypes and help us define an appropriate scope for our recommendations. We primarily talked with their developer to estimate the time he would need to complete each prototype. This helped us assess how many prototypes we could move forward with, and which ones to prioritize to stay within our client’s budget.
As a former math teacher, I insisted on calculating the first standard deviation by hand so that everyone was on the same page.
Crunching the numbers with Kano analysis
We used dot voting to pick ten prototypes for further testing, then added an eleventh to ensure that we had every major category of prototype represented. Next, we prepared a Kano survey for these eleven prototypes, and sent it to people in our primary user groups. Since Kano analysis is a quantitative method that asks people to assess how they would feel when each feature is or is not included, we supplemented it with some qualitative questions to understand why users might feel that way. We used the survey results to plot our prototypes on a graph with dysfunctional scores on the x-axis and functional scores on the y-axis, then calculated standard deviations to add error bars, and used circles around our points to represent importance scores (with the radius of the circle corresponding to the degree of importance).
Ensuring consistency
Now that we had data helping us decide which prototypes would most contribute to user satisfaction and delight, I was ready to make our low fidelity prototypes into high fidelity wireframes. My selection of which prototypes to develop was mostly informed by the Kano analysis, but there were some exceptions. I included a prototype that wasn’t tested based on a quote from the qualitative follow-ups in the Kano survey, I eliminated one prototype that did well on the Kano analysis based on a decisive stakeholder reaction, and I eliminated a second prototype that did moderately well on the Kano analysis based on my informal conversations with doctoral students. I made high fidelity wireframes that matched the existing style of Radical PhD so that they could be added without undermining the consistency of the site.
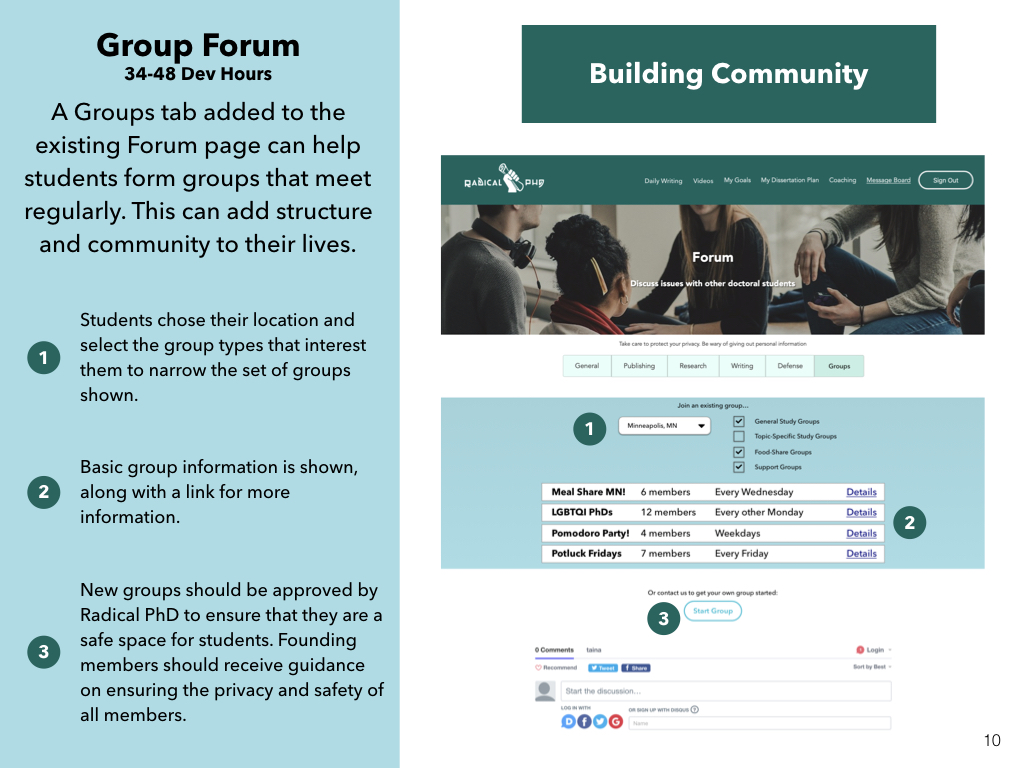
This is a high-fidelity wireframe corresponding to the low-fidelity sketch of the groups tab above
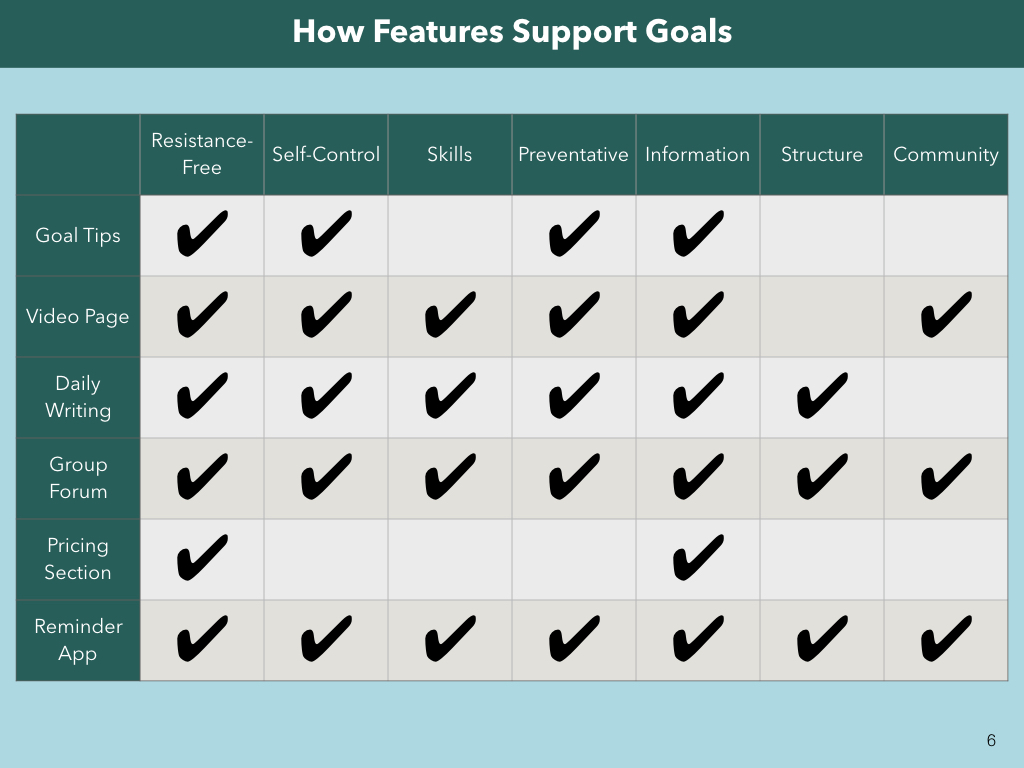
A table from my report showing which features serve which goals
Bringing it all together for the client
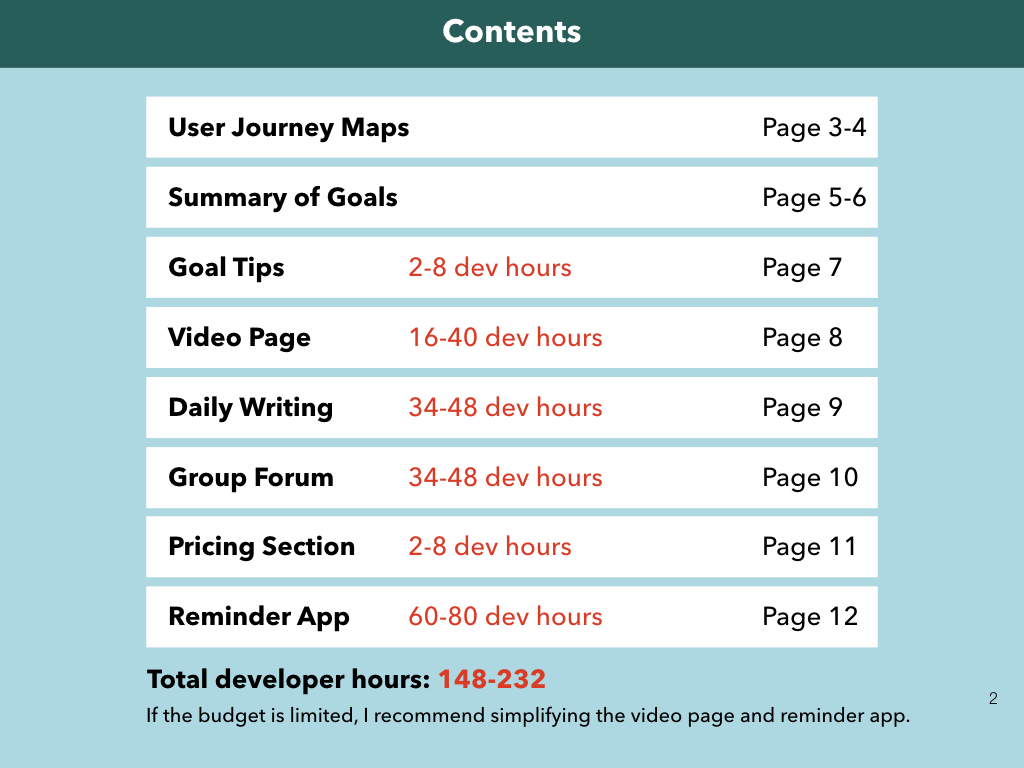
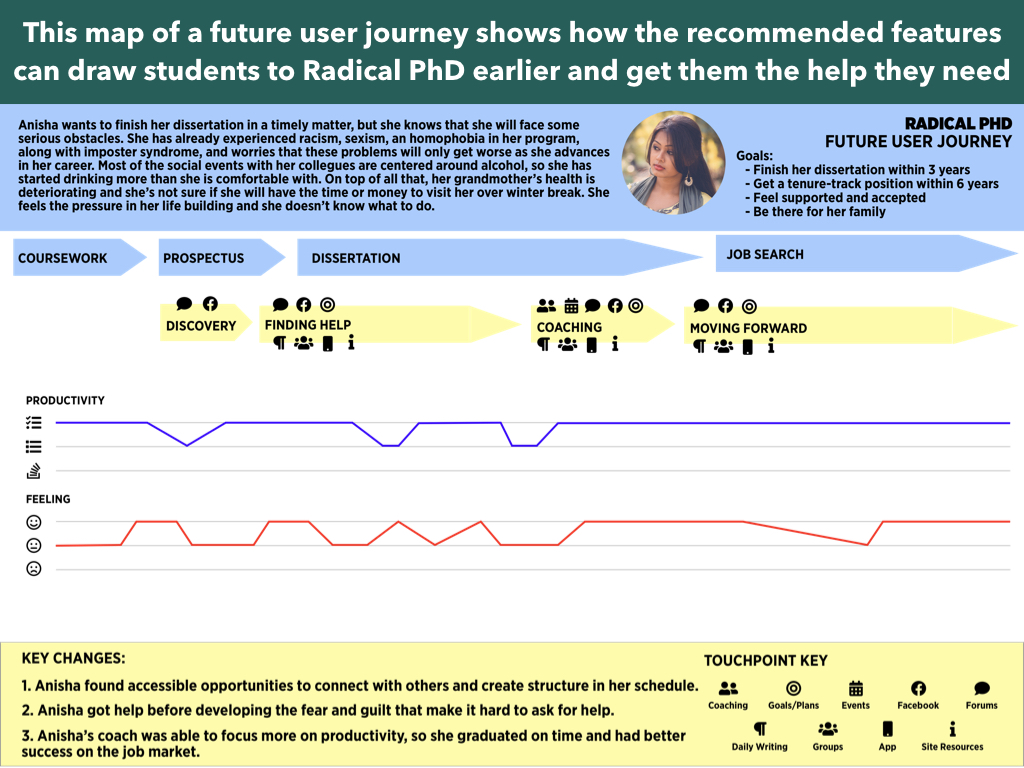
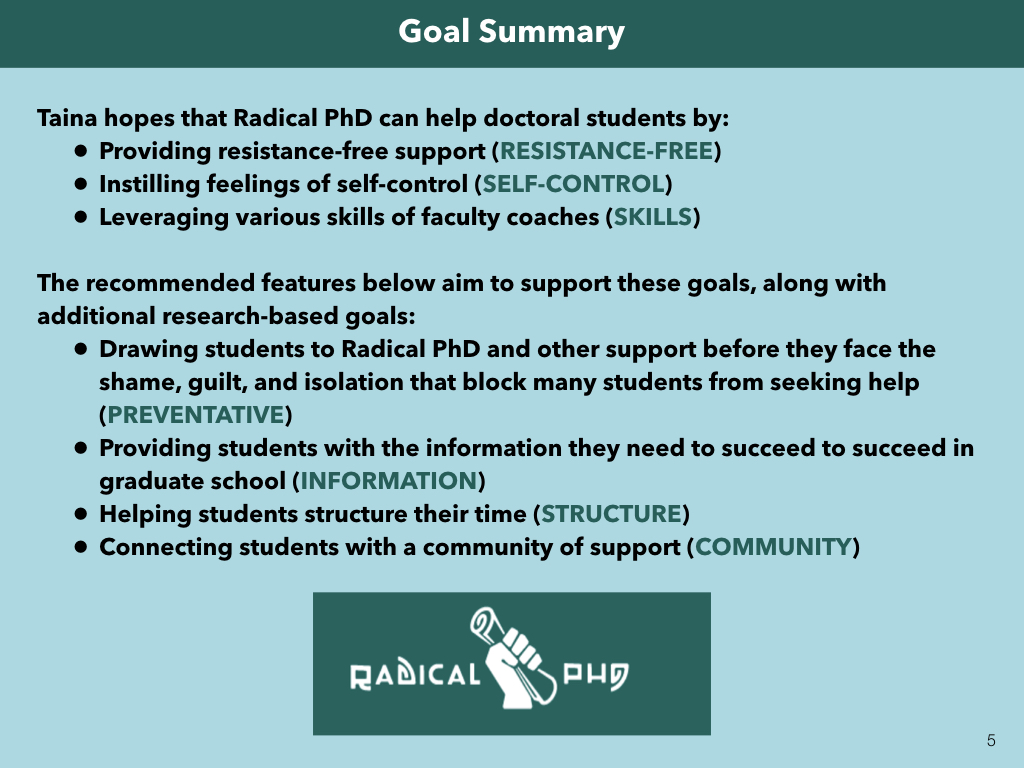
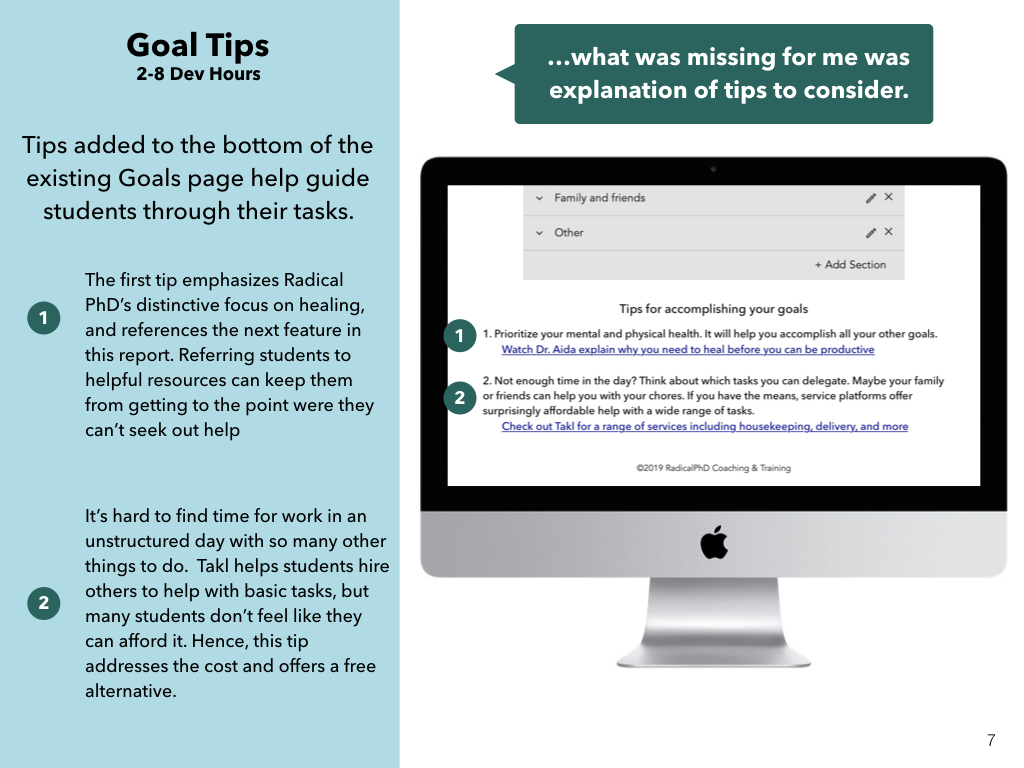
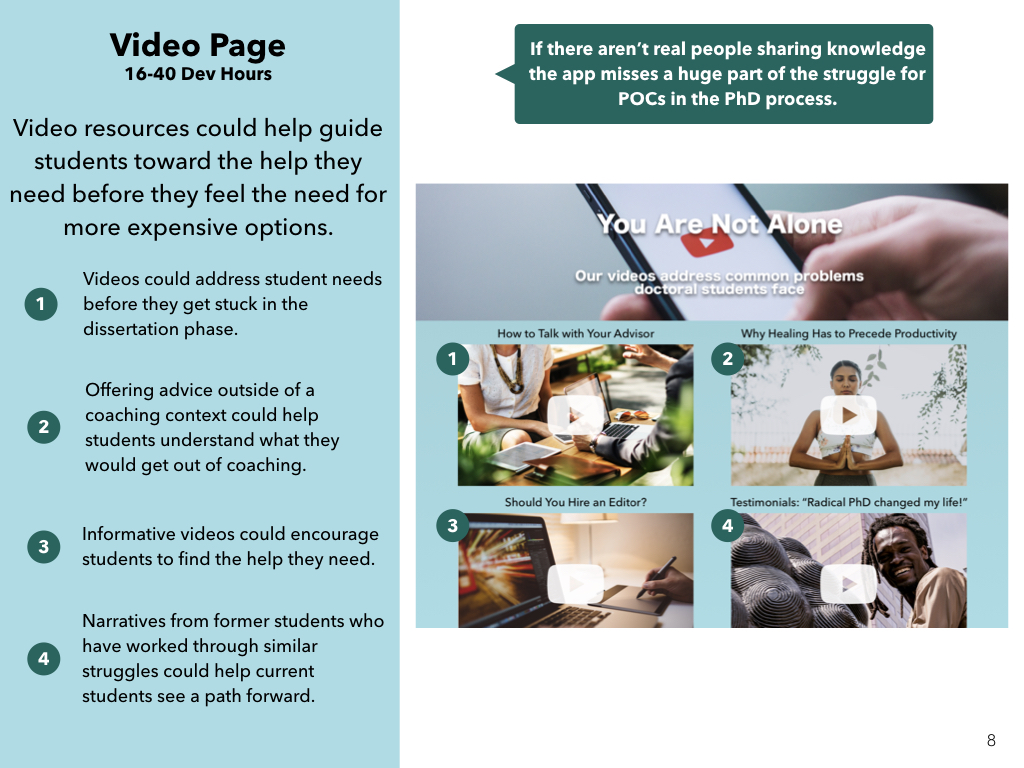
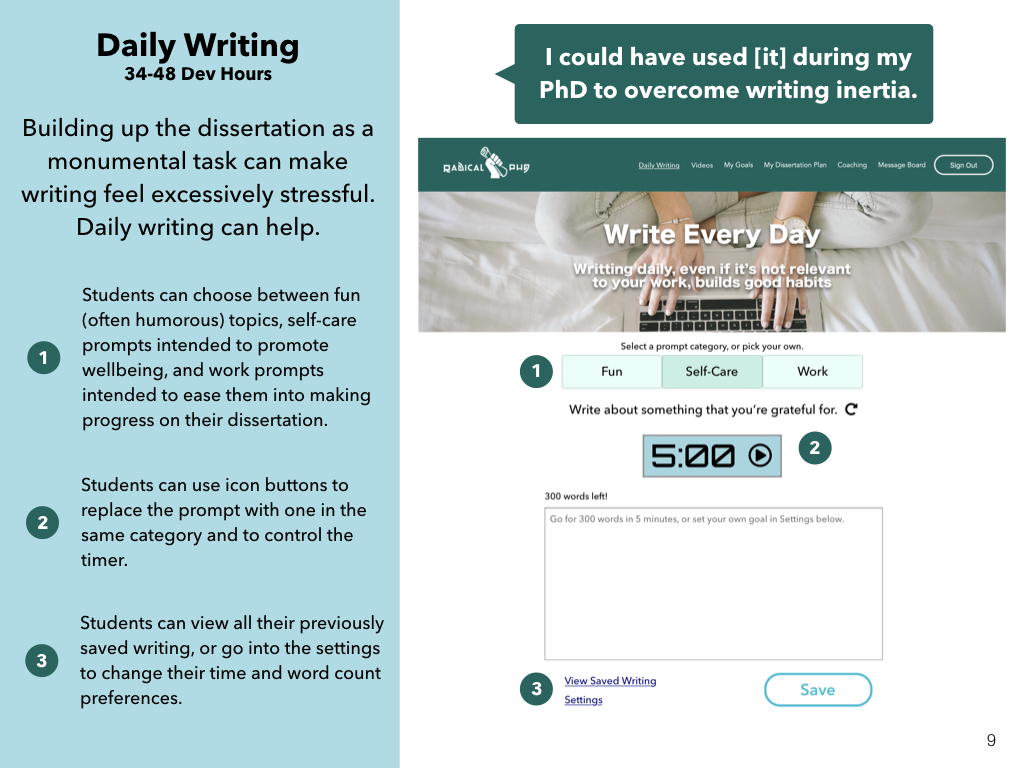
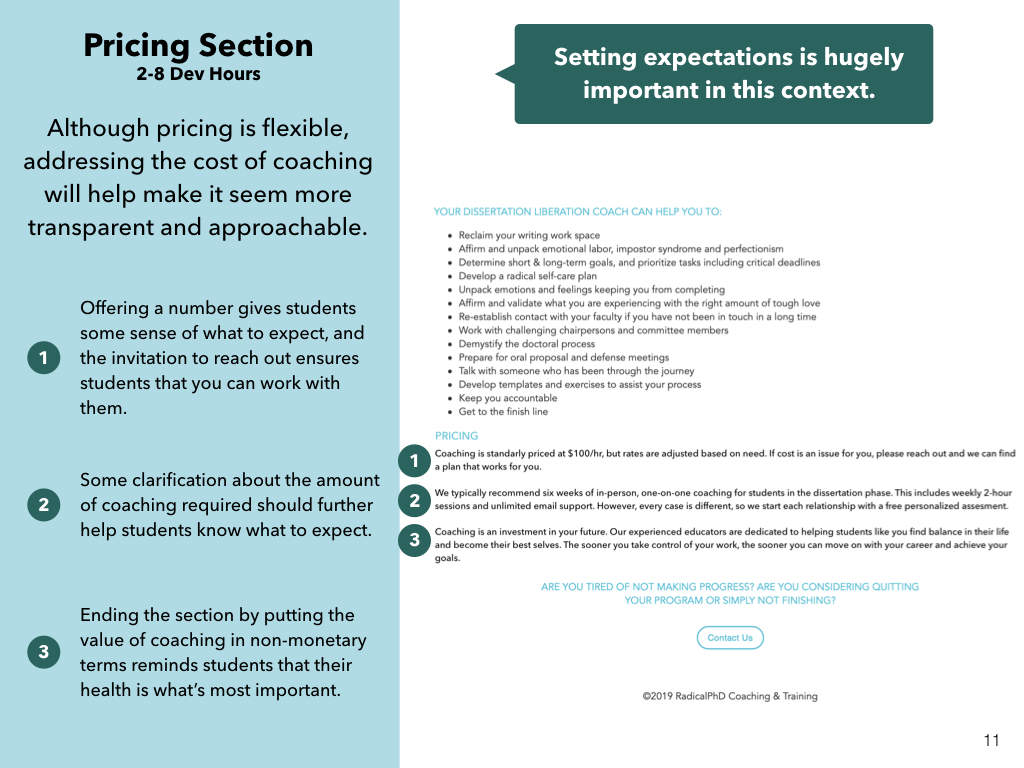
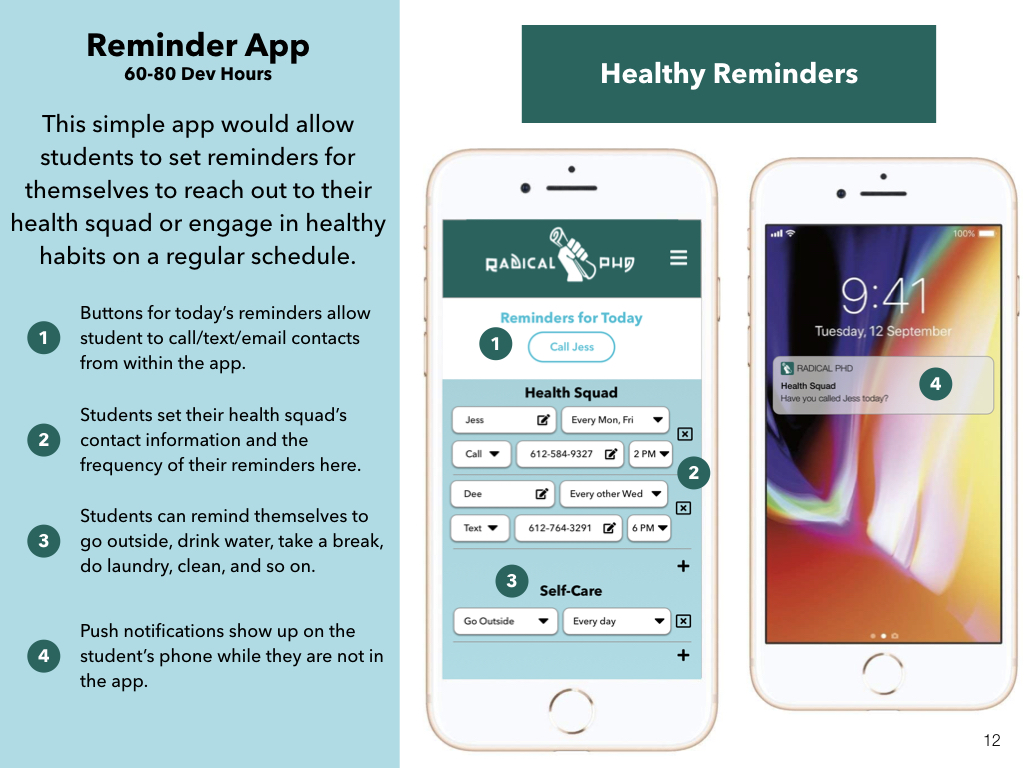
A final report (see the slideshow below), with each high-fidelity wireframe (i) annotated, (ii) motivated in terms of seven well-defined, research-backed goals, and (iii) scoped out in terms of developer hours, was submitted to Radical PhD. The six features ranged from an inexpensive content addition to a whole new phone app, and it all remained in the desired budget. I also included a future user journey map that shows how the feature recommendations would improve the user experience.